Gold's Long-Term Bull Spikes Higher
An overbought market is a bullish market...
NFTRH is a top-down macro entity, writes Gary Tanashian in his Notes
from the Rabbit
Hole, posting this just before
gold's late-Friday surge and then drop from $2400.
It is not a stock pick rag,
a technical analysis junkie, a
market psychologist or a monetary/fiscal policy obsessive. It is all of those things, as needed. But
primarily what we do is define
the macro and then continually update the definition because it is always progressing, shifting, cycling
and changing.
From that work we then try to take it from 'top-down' definition and apply it to investment
strategies.
I sometimes bristle at the hype that emanates from the precious metals sphere coming in the
form of gold bug doctrine,
perma-cheerleading, lecturing and rigid thinking. That is because – like it or not – the macro is always
shifting and, doctrine or
not, the macro shifted away from the precious metals in 2012 and only began recovering a gold-positive
view in 2018.
Since then it's been a volatile process with incomplete macro fundamentals. Incomplete, but
now turning to the preferred
macro that a gold bull would want to see and a stock bull would not want to see.
Let's be clear, "turning" is
not "turned". It is not complete, but our view of transition is being proven out slowly and now,
methodically. I still have a personal
question as to whether the forces of bubble-making (now in their 3rd decade by my estimation) can hold
'er together to and through the
presidential election.
But we don't need to have the answer to that question.
We need to manage risk and
respect market signals and TA.
Here is the thing; gold to me is an indicator as
much as it is a monetary
value retainer and risk manager. I disregard views of gold as some kind of play; as a market among other
markets.
Gold miners are a play; a play on the asset that stands outside of the Keynesian
debt/leverage system as the anti-bubble.
When anti-bubble forces become too strong and the 'bust' end of the boom/bust cycle ensues, the gold
miners should leverage the
relative performance of gold to speculative upside based on positive leverage, just as they have
chronically under-performed due to
negative leverage during intense bubble phases.
Getting off the idealist views
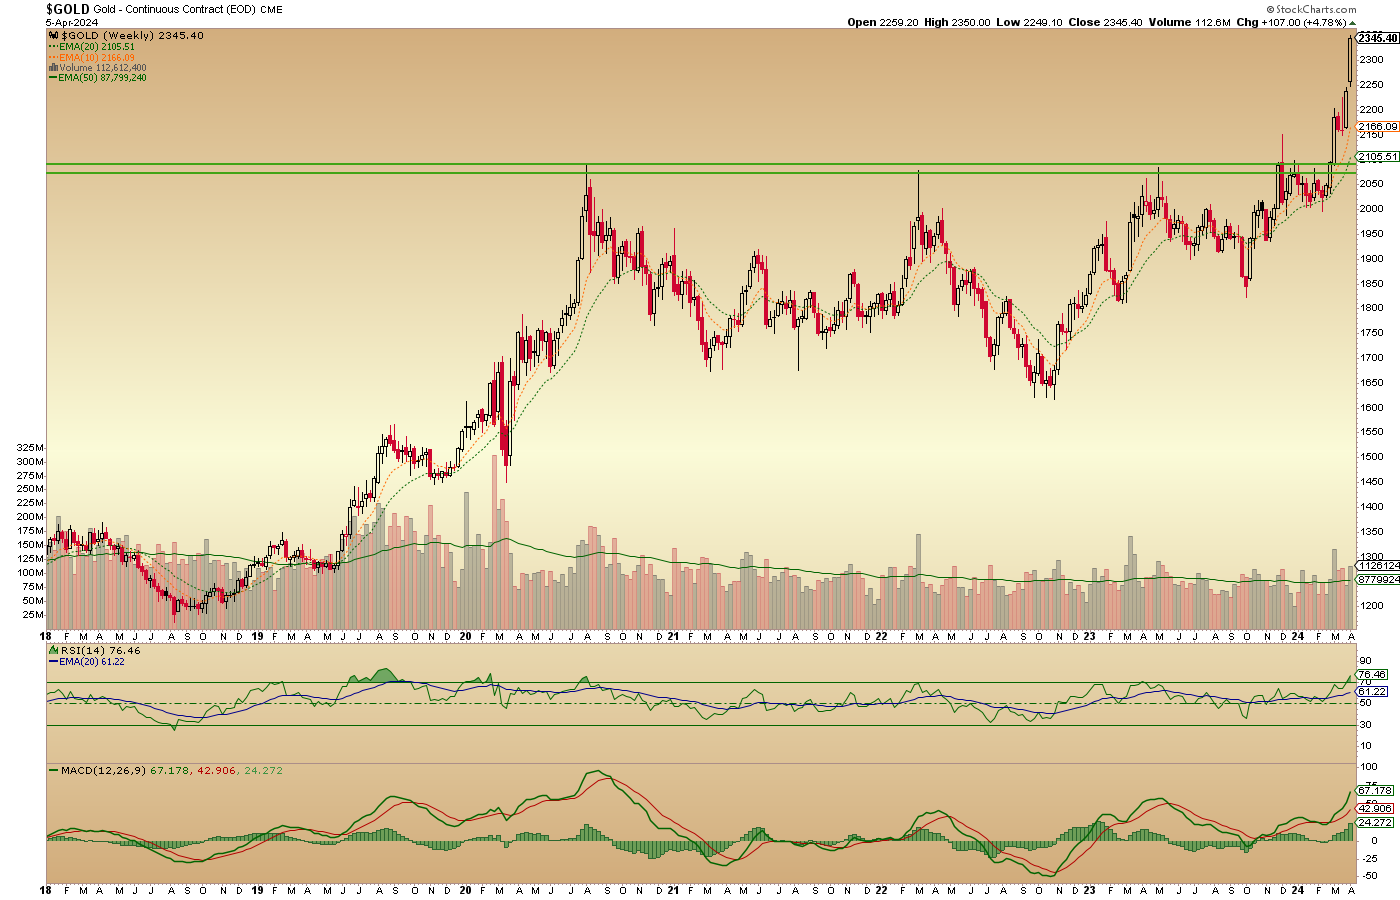
and back to the technical
view, gold's weekly chart is purely bullish. The pattern of this chart targets 2450. This is a purely
bullish breakout to blue
sky.
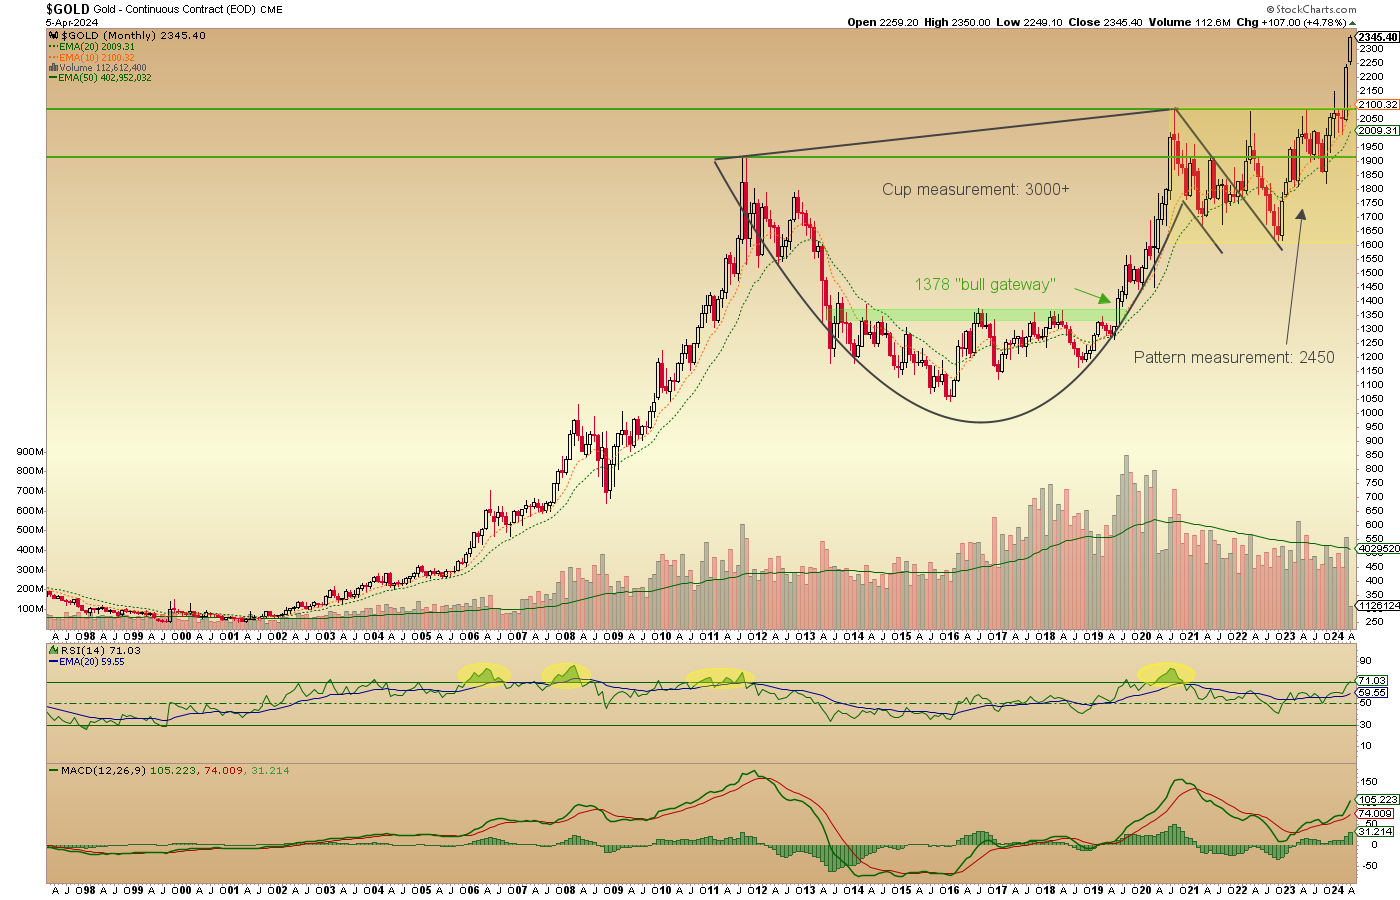
The monthly chart advises the target of the large Cup and Handle, which has been fashioned
over 10 years of pain and
pleasure. The max pleasure point had been the 2020 high, from which the Cup made its higher right side
high. After that, the smaller
pattern did its thing.
You see weekly and monthly RSI flirting with overbought
status (as is the daily), but
let's discuss this for a moment.
Traders will watch that stuff. But investors
should realize how long gold
stayed overbought during the hard up phases of the previous bull market (2005-2011) and the first up
phase of this bull market
(2019-2020). I've shaded those instances.
The thing is, an overbought market is
a sign of a bullish market.
I, who have held the metal since 2002, would not trade it (unlike the miners). But traders would do
whatever the hell they will with
GLD and other bullion holders/price trackers.
As we've been noting for months now, gold is bullish
on all time frames, with the daily finally joining the weekly and monthly in that status back in Q4,
2023.
There will be breathtaking ups and gut wrenching downs. But a turn in the macro will put a relative
tailwind to the ups for
counter-cyclical gold in the coming years. It will require a balanced view with ongoing perspective
review.


 Email
us
Email
us